
Jump to: Methodology | Winners | Losers | Full List of Sites | Categories Impacted & Analysis | Dictionaries & Reference Sites | eCommerce & Marketplaces | Travel Sites | School Review Sites | Product Reviews Sites | Health Sites | Entertainment & Music | Evidence of Experience
Six months after the September Core Update, Google announced the long-awaited March 2023 core update on March 15. This core update lasted 13 days and 7 hours (according to Google’s handy new Search Status Dashboard) and was highly anticipated given the significant changes affecting organic search in recent months, such as the Helpful Content Update, numerous Product Reviews Updates, and above all, the rise of generative AI tools.
Google also announced a new signal in its December updates to the Search Quality Rater guidelines: “E” for experience. The “E” is a new member of the E-A-T family, now called E-E-A-T, and stands for experience, expertise, authoritativeness, and trustworthiness. According to Google, the amount of E-E-A-T required for a page or site to be considered high-quality depends on the nature of the content and the extent to which it can cause harm to users. The updated guidelines also double down on the importance of effort and originality for creating high-quality content, an important consideration with the rise of generative AI content tools like ChatGPT.
Search Quality Raters have been working off of this new version of the Quality Guidelines to evaluate the quality of Google’s results for a few months now, so it’s quite possible that the outcomes of their evaluations are making their way into Google’s algorithms with this new March Core Algorithm Update.
Methodology & Disclaimers About Core Updates
For our analysis of the March 2023 Core Update, we collected the list of over 7,000 winning and losing domains in terms of their Sistrix Visibility Index scores using the Google.com U.S. index. The visibility change was calculated between March 15, 2023, and March 28, 2023 — the day the update officially concluded.
We have also pulled in category labels from Similarweb for all analyzed domains to see whether the impacts of the core update affected any particular categories more than others.
It’s important to remember that thousands, if not millions, of factors are at play in the changes we see to website rankings during a core update rollout, making it impossible to isolate exactly what happened to a site. This is especially true when analyzing sites from the outside without access to their internal data or knowing precisely how the website has changed. Technical issues, outages, or other significant website changes can also cause changes to organic ranking performance. Therefore, this data should only be used directionally.
It is also important to remember that visibility is not organic traffic and was never meant to represent organic traffic. It is a different metric. You can learn more about how Sistrix calculates visibility here.
All of that said, it can be illuminating to look at the performance of websites at scale after a core update to see if any patterns exist among winning or losing websites.
Winners of the March 2023 Core Update:
The tables below include a list of 250 domains that fell into both the winners and losers category (absolute and percent) as measured by their Sistrix Visibility Index scores on the day the update began compared to when it ended.
Absolute Winners:
Absolute winners in terms of greatest Visibility Index score increases, which represents the total overall market share gained on Google relative to all other sites on the internet:
Percentage Winners:
Percentage winners in terms of greatest percentage increases in Visibility Index scores since the start of the March Core Update:
Losers of the March 2023 Core Update:
Absolute Losers:
Absolute losers in terms of greatest Visibility Index score decreases, which represents the total overall market share lost on Google relative to all other sites on the internet:
| Domain | March 15 VI | March 28 VI | Percentage change | Absolute Change |
|---|---|---|---|---|
| wiktionary.org | 623.88 | 482.49 | -22.66% | -141.39 |
| urbandictionary.com | 137.85 | 53.57 | -61.14% | -84.29 |
| thefreedictionary.com | 149.34 | 104.71 | -29.88% | -44.62 |
| cambridge.org | 627.96 | 585.41 | -6.78% | -42.55 |
| yelp.com | 153.47 | 112.06 | -26.98% | -41.40 |
| britannica.com | 685.74 | 659.23 | -3.87% | -26.51 |
| wikivoyage.org | 46.48 | 22.45 | -51.70% | -24.03 |
| tvtropes.org | 47.28 | 27.08 | -42.73% | -20.21 |
| lawinsider.com | 58.36 | 39.41 | -32.47% | -18.95 |
| forbes.com | 210.39 | 193.63 | -7.97% | -16.76 |
| dictionary.com | 658.86 | 643.00 | -2.41% | -15.86 |
| etsy.com | 350.28 | 334.49 | -4.51% | -15.80 |
| thesaurus.com | 196.05 | 181.72 | -7.31% | -14.33 |
| healthline.com | 186.70 | 172.82 | -7.43% | -13.88 |
| mayoclinic.org | 311.15 | 297.61 | -4.35% | -13.54 |
| city-data.com | 20.17 | 6.98 | -65.41% | -13.20 |
| vacationidea.com | 24.97 | 12.82 | -48.66% | -12.15 |
| zoominfo.com | 25.58 | 14.04 | -45.09% | -11.53 |
| bhphotovideo.com | 103.85 | 92.48 | -10.95% | -11.37 |
| travelocity.com | 62.69 | 51.47 | -17.90% | -11.22 |
| travelandleisure.com | 70.64 | 59.65 | -15.55% | -10.98 |
| thebalancemoney.com | 25.84 | 15.06 | -41.74% | -10.79 |
| rottentomatoes.com | 224.62 | 213.95 | -4.75% | -10.67 |
| last.fm | 59.69 | 49.15 | -17.66% | -10.54 |
| azlyrics.com | 111.93 | 102.13 | -8.76% | -9.80 |
| archive.org | 28.87 | 19.46 | -32.57% | -9.40 |
| wellsfargo.com | 30.42 | 21.39 | -29.69% | -9.03 |
| poshmark.com | 34.36 | 25.44 | -25.94% | -8.91 |
| carid.com | 12.37 | 3.90 | -68.47% | -8.47 |
| apartments.com | 67.07 | 58.61 | -12.61% | -8.46 |
| kohls.com | 56.87 | 48.60 | -14.55% | -8.27 |
| pcmag.com | 113.81 | 105.79 | -7.05% | -8.02 |
| guru99.com | 27.28 | 19.41 | -28.84% | -7.87 |
| glassdoor.com | 47.10 | 39.26 | -16.64% | -7.84 |
| smule.com | 13.90 | 6.13 | -55.89% | -7.77 |
| govinfo.gov | 16.08 | 8.53 | -46.93% | -7.55 |
| mozilla.org | 47.17 | 40.20 | -14.79% | -6.98 |
| vogue.com | 39.66 | 32.70 | -17.57% | -6.97 |
| rollingstone.com | 34.29 | 27.44 | -19.98% | -6.85 |
| kidshealth.org | 44.08 | 37.28 | -15.42% | -6.80 |
| hulu.com | 34.46 | 27.80 | -19.33% | -6.66 |
| com.be | 8.07 | 1.68 | -79.23% | -6.39 |
| gotquestions.org | 12.89 | 6.56 | -49.10% | -6.33 |
| thoughtco.com | 21.32 | 15.00 | -29.66% | -6.32 |
| goodrx.com | 20.48 | 14.21 | -30.61% | -6.27 |
| mapquest.com | 80.92 | 74.70 | -7.69% | -6.22 |
| ldoceonline.com | 49.23 | 43.04 | -12.58% | -6.19 |
| consumerreports.org | 41.07 | 35.09 | -14.57% | -5.98 |
| businessnewsdaily.com | 29.40 | 23.64 | -19.60% | -5.76 |
| goodreads.com | 75.51 | 69.79 | -7.58% | -5.73 |
| xhamster.com | 37.03 | 31.36 | -15.29% | -5.66 |
| yamahamotorsports.com | 7.30 | 1.78 | -75.56% | -5.52 |
| digitalcameraworld.com | 29.25 | 23.76 | -18.78% | -5.49 |
| apple.com | 197.51 | 192.06 | -2.76% | -5.45 |
| cnbc.com | 68.43 | 63.01 | -7.92% | -5.42 |
| techopedia.com | 20.39 | 15.11 | -25.92% | -5.29 |
| history.com | 67.75 | 62.49 | -7.76% | -5.26 |
| healthgrades.com | 11.79 | 6.64 | -43.71% | -5.15 |
| walgreens.com | 23.59 | 18.45 | -21.81% | -5.15 |
| foursquare.com | 10.45 | 5.39 | -48.41% | -5.06 |
| tertulia.com | 6.43 | 1.46 | -77.26% | -4.97 |
| freepik.com | 34.64 | 29.85 | -13.84% | -4.79 |
| sears.com | 17.89 | 13.15 | -26.49% | -4.74 |
| chron.com | 34.75 | 30.04 | -13.56% | -4.71 |
| lukiegames.com | 13.22 | 8.54 | -35.40% | -4.68 |
| disneyplus.com | 16.00 | 11.41 | -28.72% | -4.60 |
| nfl.com | 29.86 | 25.35 | -15.11% | -4.51 |
| expedia.com | 199.47 | 194.96 | -2.26% | -4.51 |
| songmeanings.com | 33.30 | 28.80 | -13.50% | -4.50 |
| familyhandyman.com | 31.71 | 27.22 | -14.17% | -4.49 |
| usbank.com | 19.52 | 15.10 | -22.63% | -4.42 |
| people.com | 50.50 | 46.10 | -8.71% | -4.40 |
| hopkinsmedicine.org | 76.69 | 72.36 | -5.65% | -4.33 |
| softwaretestinghelp.com | 30.36 | 26.04 | -14.24% | -4.32 |
| kayak.com | 152.25 | 147.99 | -2.80% | -4.26 |
| songfacts.com | 39.64 | 35.48 | -10.50% | -4.16 |
| wikihow.com | 86.41 | 82.31 | -4.74% | -4.09 |
| dnb.com | 15.30 | 11.25 | -26.46% | -4.05 |
| letterboxd.com | 13.00 | 8.98 | -30.97% | -4.03 |
| biblestudytools.com | 16.23 | 12.26 | -24.45% | -3.97 |
| monster.com | 21.57 | 17.61 | -18.35% | -3.96 |
| rd.com | 48.69 | 44.80 | -7.99% | -3.89 |
| cntraveler.com | 27.98 | 24.11 | -13.83% | -3.87 |
| livescience.com | 21.82 | 17.98 | -17.62% | -3.85 |
| techradar.com | 41.35 | 37.54 | -9.22% | -3.81 |
| frontiersin.org | 17.68 | 13.89 | -21.43% | -3.79 |
| tenor.com | 15.23 | 11.44 | -24.87% | -3.79 |
| waze.com | 12.86 | 9.09 | -29.35% | -3.78 |
| chase.com | 13.86 | 10.10 | -27.17% | -3.77 |
| plannedparenthood.org | 19.23 | 15.51 | -19.34% | -3.72 |
| softpedia.com | 6.99 | 3.29 | -52.87% | -3.70 |
| digitaltrends.com | 26.09 | 22.43 | -14.03% | -3.66 |
| everydayhealth.com | 23.99 | 20.34 | -15.25% | -3.66 |
| onetonline.org | 8.31 | 4.68 | -43.64% | -3.63 |
| enterprise.com | 14.99 | 11.38 | -24.08% | -3.61 |
| airbnb.com | 19.46 | 15.87 | -18.41% | -3.58 |
| thrillist.com | 13.89 | 10.33 | -25.60% | -3.55 |
| shazam.com | 7.63 | 4.15 | -45.66% | -3.48 |
| engadget.com | 13.75 | 10.32 | -24.96% | -3.43 |
| retailmenot.com | 12.52 | 9.26 | -26.00% | -3.25 |
| deviantart.com | 9.82 | 6.62 | -32.61% | -3.20 |
| explainthatstuff.com | 6.30 | 3.11 | -50.69% | -3.20 |
| goat.com | 4.65 | 1.48 | -68.12% | -3.17 |
| flightstats.com | 6.53 | 3.45 | -47.09% | -3.07 |
| hrw.org | 11.16 | 8.09 | -27.50% | -3.07 |
| handluggageonly.co.uk | 9.50 | 6.43 | -32.26% | -3.06 |
| xfinity.com | 8.59 | 5.55 | -35.31% | -3.03 |
| careeronestop.org | 7.83 | 4.82 | -38.49% | -3.01 |
| schwab.com | 10.08 | 7.20 | -28.60% | -2.88 |
| spydialer.com | 5.62 | 2.89 | -48.61% | -2.73 |
| forrent.com | 8.85 | 6.13 | -30.74% | -2.72 |
| ducksters.com | 10.20 | 7.48 | -26.59% | -2.71 |
| vudu.com | 8.72 | 6.02 | -30.98% | -2.70 |
| lyricsfreak.com | 6.99 | 4.39 | -37.25% | -2.60 |
| pagesix.com | 10.27 | 7.69 | -25.15% | -2.58 |
| mailchimp.com | 8.94 | 6.36 | -28.85% | -2.58 |
| publicschoolreview.com | 5.76 | 3.22 | -44.11% | -2.54 |
| aclu.org | 7.31 | 4.80 | -34.35% | -2.51 |
| untappd.com | 4.03 | 1.55 | -61.54% | -2.48 |
| wikiwand.com | 8.63 | 6.15 | -28.69% | -2.47 |
| ranker.com | 6.99 | 4.55 | -34.99% | -2.45 |
| videvo.net | 9.43 | 7.03 | -25.39% | -2.39 |
| filehorse.com | 5.38 | 3.08 | -42.81% | -2.30 |
| busytourist.com | 6.84 | 4.54 | -33.62% | -2.30 |
| flightclub.com | 4.18 | 1.88 | -54.99% | -2.30 |
| zumper.com | 8.88 | 6.60 | -25.69% | -2.28 |
| mouser.com | 7.62 | 5.44 | -28.56% | -2.18 |
| whereig.com | 4.13 | 1.98 | -52.09% | -2.15 |
| classiccars.com | 5.12 | 2.97 | -42.04% | -2.15 |
| musixmatch.com | 7.08 | 4.97 | -29.86% | -2.12 |
| carparts.com | 7.55 | 5.48 | -27.43% | -2.07 |
| moovitapp.com | 8.05 | 6.00 | -25.46% | -2.05 |
| myfreemp3.to | 3.93 | 1.93 | -51.02% | -2.01 |
| greenfieldpuppies.com | 7.40 | 5.40 | -26.99% | -2.00 |
| wikiquote.org | 4.16 | 2.17 | -47.86% | -1.99 |
| lagged.com | 5.05 | 3.07 | -39.20% | -1.98 |
| tandfonline.com | 6.33 | 4.35 | -31.23% | -1.97 |
| tureng.com | 5.49 | 3.53 | -35.78% | -1.97 |
| travellersworldwide.com | 5.04 | 3.10 | -38.52% | -1.94 |
| seatgeek.com | 7.37 | 5.44 | -26.17% | -1.93 |
| zipdatamaps.com | 4.52 | 2.60 | -42.55% | -1.92 |
| fashionnova.com | 3.44 | 1.53 | -55.46% | -1.91 |
| monday.com | 5.88 | 3.99 | -32.15% | -1.89 |
| farmers.com | 6.95 | 5.09 | -26.78% | -1.86 |
| pastemagazine.com | 5.67 | 3.82 | -32.55% | -1.85 |
| lancasterpuppies.com | 6.83 | 5.01 | -26.66% | -1.82 |
| thetrendspotter.net | 4.40 | 2.62 | -40.39% | -1.78 |
| truepeoplesearch.com | 2.88 | 1.16 | -59.77% | -1.72 |
| consumeraffairs.com | 5.56 | 3.84 | -30.91% | -1.72 |
| kiplinger.com | 4.92 | 3.20 | -34.91% | -1.72 |
| lovehairstyles.com | 6.29 | 4.61 | -26.69% | -1.68 |
| quantamagazine.org | 4.18 | 2.51 | -39.90% | -1.67 |
| weatherbug.com | 5.32 | 3.68 | -30.79% | -1.64 |
| malegislature.gov | 4.68 | 3.10 | -33.71% | -1.58 |
| northerntool.com | 5.54 | 3.97 | -28.40% | -1.57 |
| financesonline.com | 2.93 | 1.36 | -53.45% | -1.57 |
| ontheworldmap.com | 3.32 | 1.78 | -46.46% | -1.54 |
| marchofdimes.org | 4.88 | 3.36 | -31.01% | -1.51 |
| vermont.gov | 4.95 | 3.46 | -30.15% | -1.49 |
| latlong.net | 3.15 | 1.68 | -46.59% | -1.47 |
| archiveofourown.org | 4.07 | 2.61 | -35.92% | -1.46 |
| clinicaltrials.gov | 3.48 | 2.03 | -41.72% | -1.45 |
| texastribune.org | 4.80 | 3.35 | -30.23% | -1.45 |
| high-schools.com | 2.43 | 1.00 | -58.77% | -1.43 |
| nejm.org | 4.23 | 2.81 | -33.49% | -1.42 |
| riteaid.com | 4.07 | 2.68 | -34.18% | -1.39 |
| fixya.com | 4.28 | 2.91 | -32.00% | -1.37 |
| hotpads.com | 3.58 | 2.22 | -38.16% | -1.37 |
| schooldigger.com | 2.87 | 1.53 | -46.64% | -1.34 |
| emojipedia.org | 2.38 | 1.05 | -56.01% | -1.33 |
| todaysparent.com | 4.46 | 3.13 | -29.87% | -1.33 |
| horoscope.com | 3.43 | 2.10 | -38.79% | -1.33 |
| mt.gov | 5.27 | 3.95 | -25.09% | -1.32 |
| cpubenchmark.net | 3.51 | 2.19 | -37.53% | -1.32 |
| nami.org | 4.35 | 3.07 | -29.35% | -1.28 |
| zzounds.com | 3.56 | 2.28 | -35.78% | -1.27 |
| wellgames.com | 4.00 | 2.73 | -31.78% | -1.27 |
| marriage.com | 3.76 | 2.49 | -33.69% | -1.26 |
| downdetector.com | 4.35 | 3.09 | -29.01% | -1.26 |
| softlay.com | 4.32 | 3.05 | -29.22% | -1.26 |
| phonescoop.com | 4.65 | 3.43 | -26.21% | -1.22 |
| pewtrusts.org | 2.39 | 1.17 | -50.96% | -1.22 |
| behindthevoiceactors.com | 3.00 | 1.79 | -40.41% | -1.21 |
| singleplatform.com | 2.84 | 1.66 | -41.39% | -1.17 |
| 411.com | 3.03 | 1.87 | -38.28% | -1.16 |
| thedressoutlet.com | 2.21 | 1.06 | -52.10% | -1.15 |
| knowyourmeme.com | 4.18 | 3.03 | -27.49% | -1.15 |
| westlaw.com | 2.36 | 1.21 | -48.62% | -1.15 |
| simplypsychology.org | 4.06 | 2.92 | -28.01% | -1.14 |
| puppyspot.com | 2.64 | 1.51 | -42.80% | -1.13 |
| songtexte.com | 2.87 | 1.75 | -39.28% | -1.13 |
| findagrave.com | 2.49 | 1.37 | -45.06% | -1.12 |
| pcrichard.com | 3.94 | 2.81 | -28.54% | -1.12 |
| nidirect.gov.uk | 4.48 | 3.36 | -24.97% | -1.12 |
| thefractioncalculator.com | 2.31 | 1.20 | -47.98% | -1.11 |
| constantcontact.com | 3.80 | 2.70 | -29.03% | -1.10 |
| ukutabs.com | 2.29 | 1.19 | -47.99% | -1.10 |
| nature.org | 4.14 | 3.04 | -26.52% | -1.10 |
| intelius.com | 2.25 | 1.16 | -48.36% | -1.09 |
| muckrack.com | 4.04 | 2.95 | -26.89% | -1.09 |
| zmenu.com | 2.98 | 1.90 | -36.22% | -1.08 |
| petri.com | 2.52 | 1.45 | -42.67% | -1.08 |
| edsurge.com | 2.40 | 1.33 | -44.69% | -1.07 |
| airdroid.com | 3.61 | 2.55 | -29.43% | -1.06 |
| 50states.com | 2.75 | 1.70 | -38.20% | -1.05 |
| weatherspark.com | 2.22 | 1.17 | -47.11% | -1.04 |
| cuyahogacounty.us | 2.87 | 1.84 | -35.87% | -1.03 |
| partsgeek.com | 2.04 | 1.01 | -50.39% | -1.03 |
| onlineconverter.com | 3.37 | 2.35 | -30.41% | -1.03 |
| lego.com | 3.88 | 2.87 | -26.11% | -1.01 |
| lawdepot.com | 3.57 | 2.55 | -28.36% | -1.01 |
| siriusxm.com | 3.81 | 2.80 | -26.48% | -1.01 |
| zoro.com | 2.65 | 1.65 | -37.94% | -1.01 |
| palmettostatearmory.com | 2.91 | 1.91 | -34.54% | -1.01 |
| storyblocks.com | 3.04 | 2.05 | -32.71% | -1.00 |
| autoanything.com | 2.97 | 1.98 | -33.38% | -0.99 |
| resume.io | 2.81 | 1.81 | -35.33% | -0.99 |
| artnews.com | 3.52 | 2.54 | -27.86% | -0.98 |
| lodging-world.com | 2.30 | 1.32 | -42.52% | -0.98 |
| profootballhof.com | 3.19 | 2.22 | -30.33% | -0.97 |
| batterymart.com | 2.43 | 1.47 | -39.61% | -0.96 |
| neverbounce.com | 2.89 | 1.93 | -33.21% | -0.96 |
| ice.gov | 3.16 | 2.20 | -30.24% | -0.96 |
| jpost.com | 2.07 | 1.12 | -45.80% | -0.95 |
| freethesaurus.com | 2.81 | 1.87 | -33.53% | -0.94 |
| speedycash.com | 3.19 | 2.25 | -29.50% | -0.94 |
| backmarket.com | 3.72 | 2.78 | -25.15% | -0.94 |
| zulily.com | 3.13 | 2.19 | -29.89% | -0.94 |
| crossword-solver.io | 2.03 | 1.11 | -45.46% | -0.92 |
| adoptapet.com | 3.46 | 2.54 | -26.56% | -0.92 |
| safeway.com | 3.36 | 2.45 | -27.29% | -0.92 |
| aflac.com | 2.74 | 1.84 | -32.93% | -0.90 |
| ereplacementparts.com | 2.77 | 1.88 | -32.41% | -0.90 |
| fee.org | 3.55 | 2.66 | -25.10% | -0.89 |
| convertworld.com | 2.17 | 1.29 | -40.64% | -0.88 |
| jpmorgan.com | 3.05 | 2.17 | -28.79% | -0.88 |
| firemountaingems.com | 2.91 | 2.03 | -30.10% | -0.88 |
| mustgo.com | 2.75 | 1.88 | -31.76% | -0.87 |
| numlookup.com | 3.08 | 2.22 | -28.08% | -0.87 |
| betmgm.com | 2.71 | 1.85 | -31.79% | -0.86 |
| 270towin.com | 2.60 | 1.74 | -33.05% | -0.86 |
| infoworld.com | 3.17 | 2.32 | -26.95% | -0.86 |
| aplaceformom.com | 2.48 | 1.63 | -34.35% | -0.85 |
| tradingview.com | 2.41 | 1.56 | -35.14% | -0.85 |
| havecamerawilltravel.com | 2.53 | 1.69 | -33.36% | -0.85 |
| fossbytes.com | 2.38 | 1.54 | -35.42% | -0.84 |
| sarahscoop.com | 1.89 | 1.06 | -44.16% | -0.84 |
| greekreporter.com | 2.03 | 1.19 | -41.07% | -0.83 |
| trip101.com | 2.95 | 2.12 | -27.99% | -0.82 |
| thetakeout.com | 2.48 | 1.66 | -33.00% | -0.82 |
Percentage Losers:
Percentage losers in terms of greatest percentage decreases in Visibility Index scores since the start of the March Core Update:
Full List of Sites
Full list of the 7,000+ analyzed sites (you can search for sites here using the search bar):
Categories Impacted by the March 2023 Core Update
Below, we have joined the list of 7,000+ winning and losing domains to their assigned Primary Category and Secondary Category in Similarweb’s list of website categories.
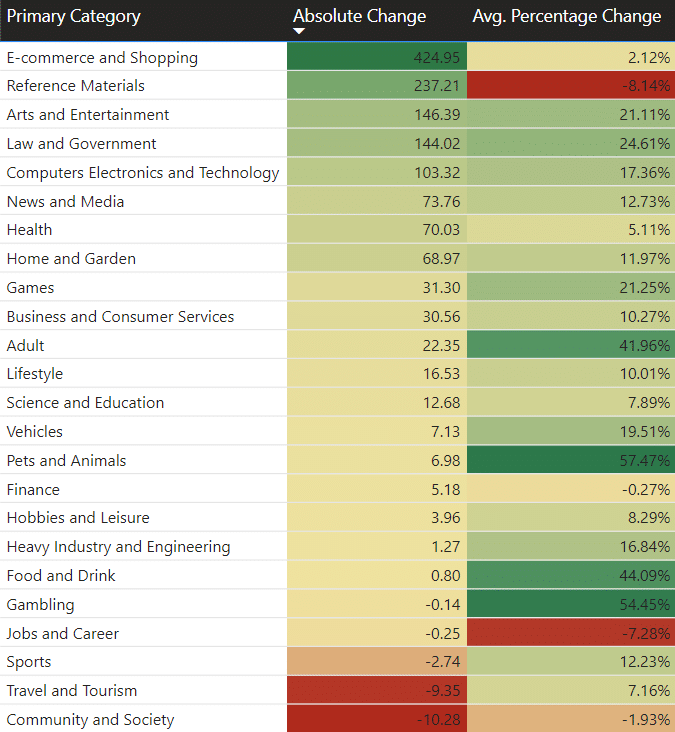
According to this data, eCommerce and shopping represented the biggest winning category in terms of overall growth. However, 345.2 out of those 424.95 visibility points can be attributed to just one site: Amazon. eBay also grew by 112.9 points, a large contributor to the growth of the e-commerce category. Home Depot contributed 37.8 points as well.
Similarly, the growth of the “Reference Materials” category — which refers to dictionaries and other reference sites — is largely consumed by Wikipedia, which earned a whopping 605.29 visibility points throughout this update. This is a bit misleading because many of the biggest losers also fell into this category, which explains the average percentage decrease of -8.14% across the category. We’ll explain more below:
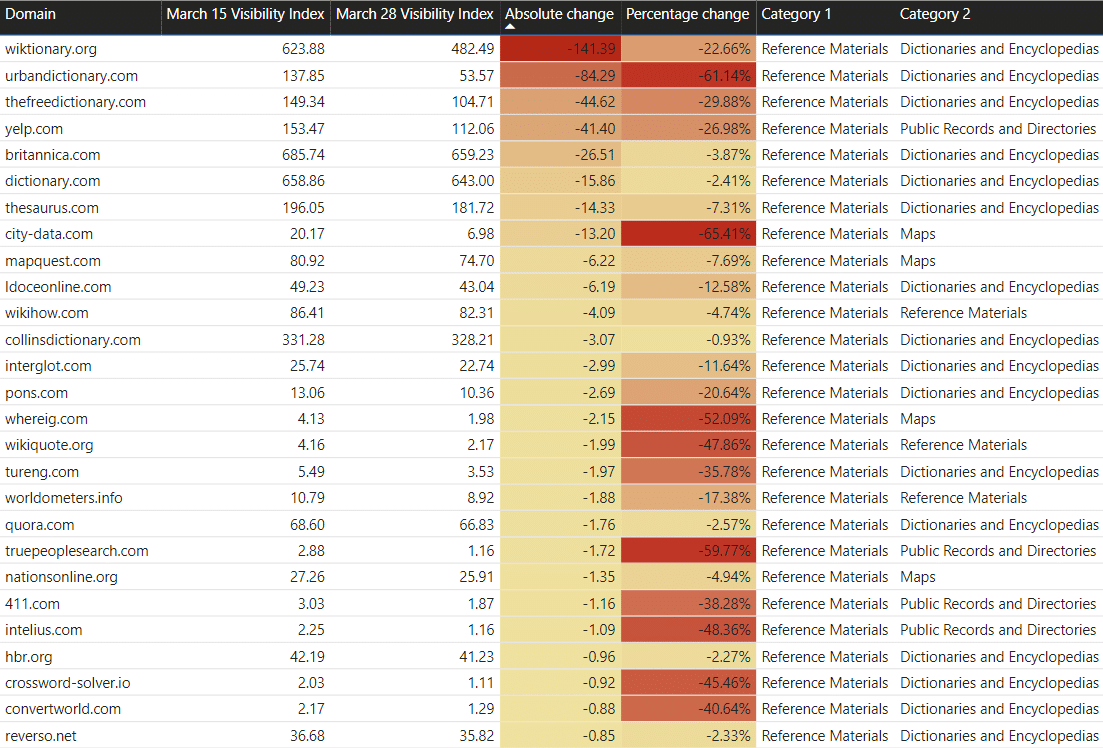
Reference Materials, Dictionaries, and Question Sites
While Wikipedia tips the scales toward showing the “Reference Materials” category as the biggest winning category of this update, that data is misleading. Wikipedia has the largest market share of any site in Sistrix Visibility’s index, so any slight change to its visibility (10.16% growth, in this case) represents a massive shift in visibility and rankings across Google.
However, a number of smaller reference sites took a big hit with this update, particularly wiktionary.org and urbandictionary.com, which lost -141.39 and -84.29 visibility points, respectively.
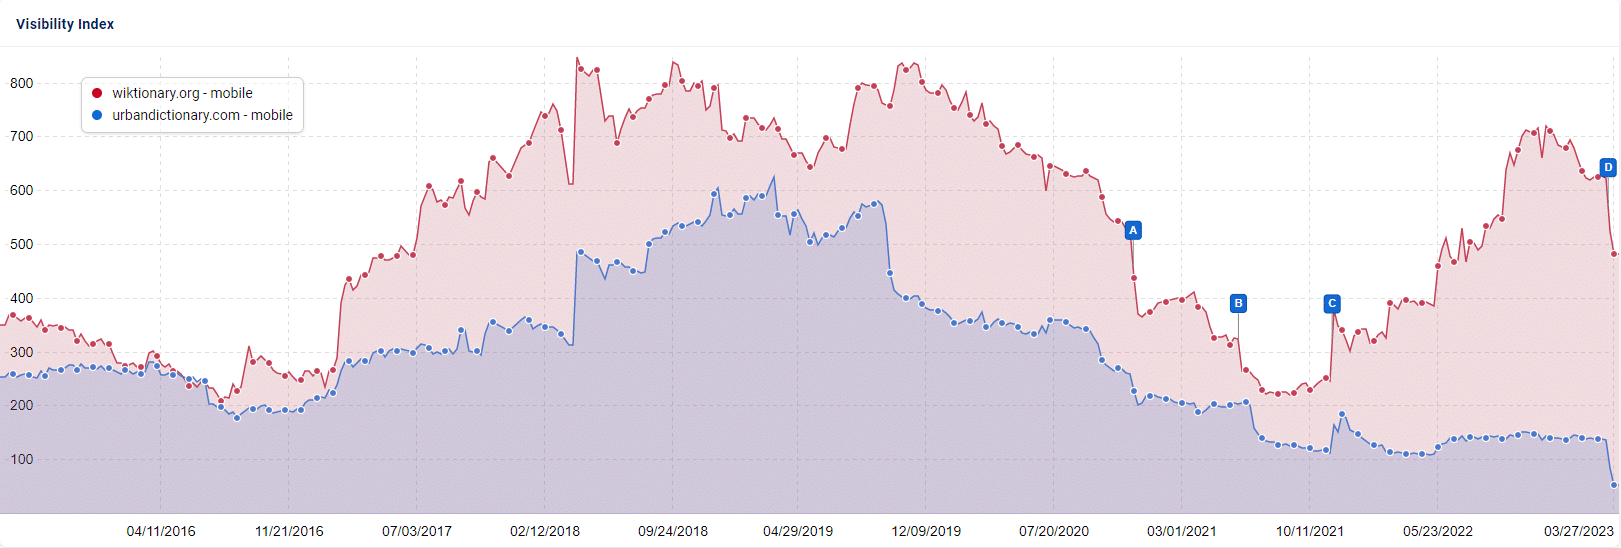
The chart below shows the growth and decline of both wiktionary.org and urbandictionary.com, which demonstrate similar visibility patterns. Both sites were negatively impacted around the time of the December 2020 Core Update (letter A), and both took a nosedive with the March 2023 Core Update.
It is common for reference and dictionary sites to be heavily impacted by core updates, which I’ve written about in previous articles, such as the impacts of the September 2022 Core Update. While the usability, technical debt, and overall helpfulness of the sites themselves are a major consideration of why the sites experience so much volatility, one other factor could be tied to user intent: how much does a dictionary site — or multiple dictionary sites — meet the needs and expectations of the user? Is there another site that better serves their needs?
This is addressed in the ‘ “Needs Met” section of Google’s search quality guidelines. Perhaps, if Google received enough feedback that certain search queries are best met with dictionary results (or not), this could recalibrate the number of these sites shown after a core update.
Other reference sites that are not technically “dictionaries” but contain a robust index of resources, music notes, equations, or definitions on a given topic felt significant negative impacts as a result of this update, such as:
- city-data.com (-67%)
- untappd.com (-61%)
- emojipedia.com (-56%)
- softpedia.com (-52%)
- explainthatstuff.com (-50%)
- gotquestions.org (-49%)
- wikiquote.org (-47%)
- tvtropes.org (-42%)
What these sites generally have in common is that they don’t have their own unique product offering per se, but rather, they aggregate information and data from elsewhere around the internet.
ECommerce Sites & Marketplaces
Amazon, eBay, Walmart, and Alibaba, in the aggregate, caused the eCommerce category to appear as a winning category due to their enormous share of organic visibility on Google.
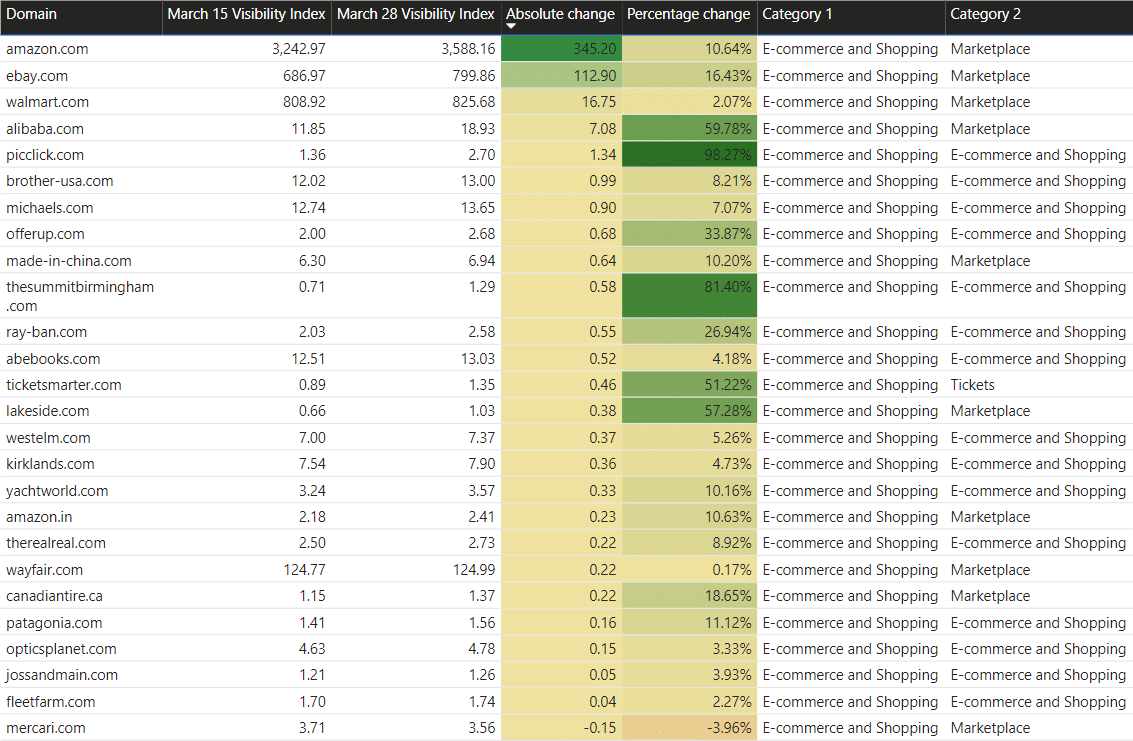
However, the massive overall increases driven by these few sites only represent a 2.12% growth to the category, and that’s due to many smaller eCommerce sites losing visibility during the March 2023 core update.
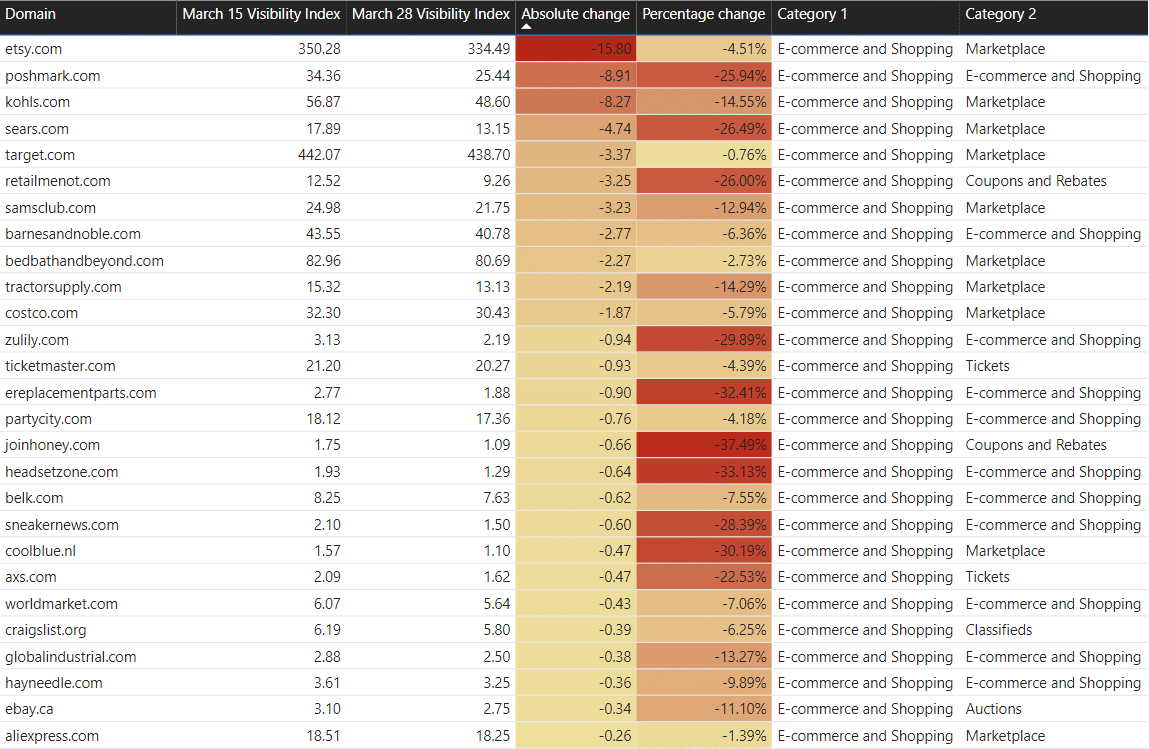
While the above eCommerce sites hold a much smaller market share in their total visibility, the percentage decreases felt by these sites were significant, with some losing over 30% of their SEO visibility.
Travel Sites
The travel category felt significant volatility as a result of the March 2023 Core Update.
Below are the biggest absolute losers in this category:
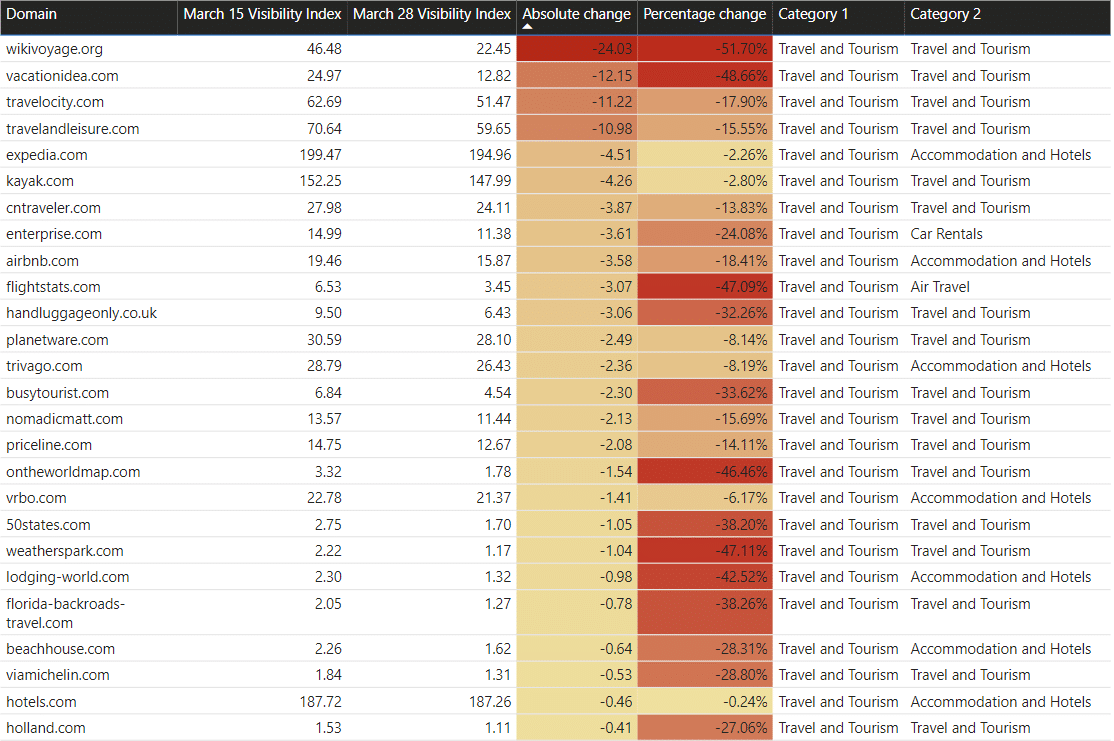
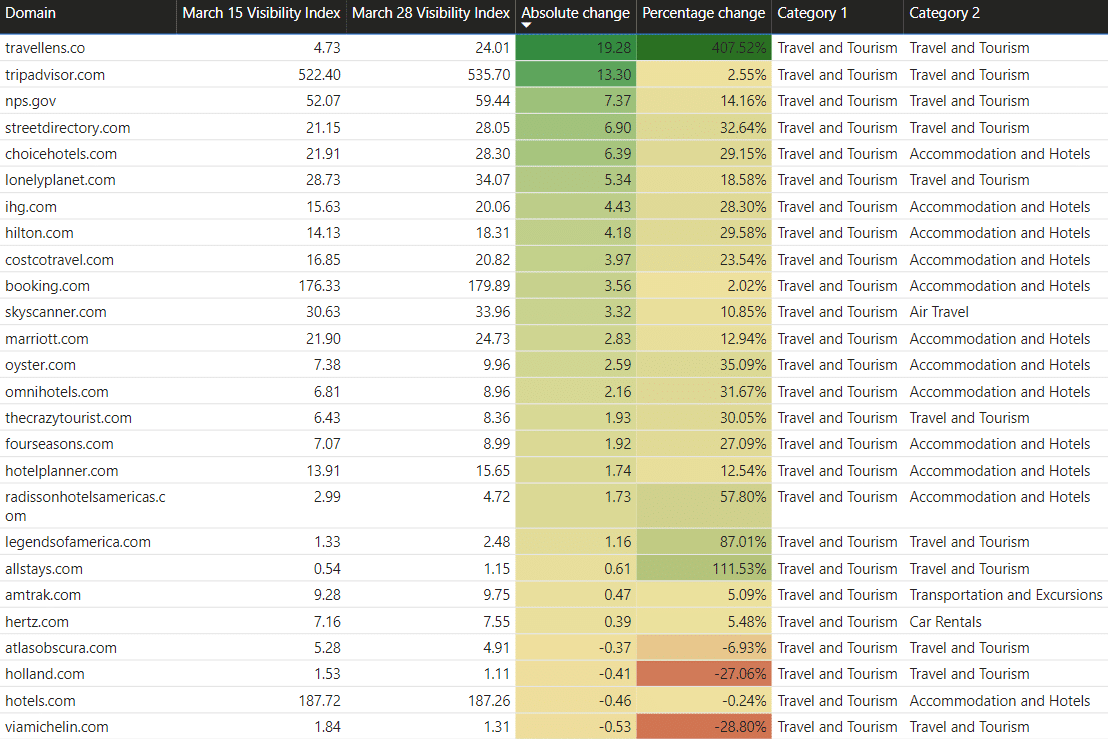
One interesting pattern among the winners and losers in the travel category is that many of the winning sites are the hotels themselves, such as IHG, Hilton, Marriott, Omni, Four Seasons, Radisson, and others. The losers tend to fall more into the affiliate category (with some significant affiliate winners being the exception).
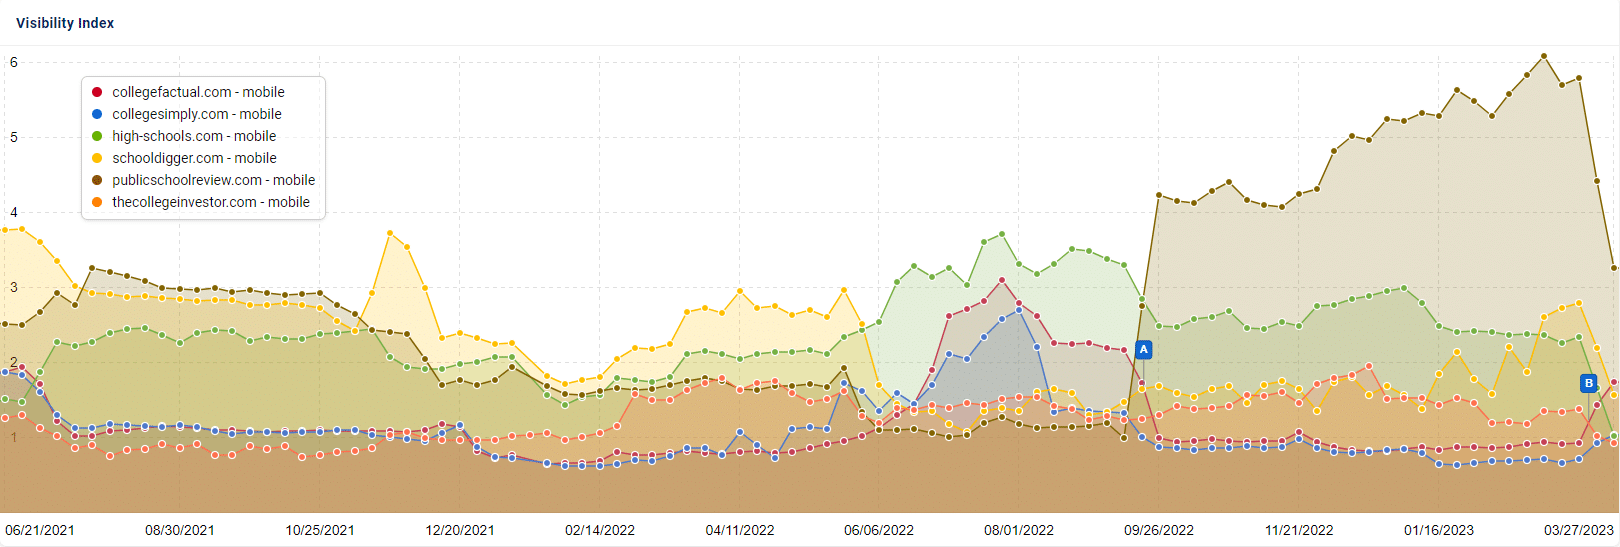
School Review Sites
Several sites that review or provide affiliate links to schools and universities were impacted by this update, such as:
Winning sites:
- collegefactual.com (82%)
- collegesimply.com (42%)
- rsschools.net (39%)
- schoolwires.net (24%)
- bestcolleges.com (17%)
- thebestschools.rog (14%)
Losing sites:
- high-schools.com (-58%)
- schooldigger.com (-46%)
- publicschoolreview.com (-44%)
- thecollegeinvestor.com (-26%)
- collegegazette.com (-24%)
- collegevine.com (-12%)
Below is a view of what some of those visibility changes look like during this update (the March 2023 Core Update is marked with the letter ‘B’):
Product Review Sites
Google has published 6 Product Reviews updates in the last couple of years, which have wreaked havoc on many sites either focusing on product reviews or containing a section dedicated to reviews. This update seems to have reconciled those ranking declines for some sites while causing declines to other sites in this category.
Winning product reviews sites:
- androidpolice.com (166%)
- feltmagnet.com (163%)
- crazyegg.com (82%)
- mybartender (58%)
- dontwasteyourmoney.com (58%)
- the-home-cinema-guide.com (42%)
Losing product reviews sites:
- thebalancemoney.com (-41%)
- consumeraffairs.com (-31%)
- businessnewsdaily.com (-19%)
- digitalcameraworld.com (-18%)

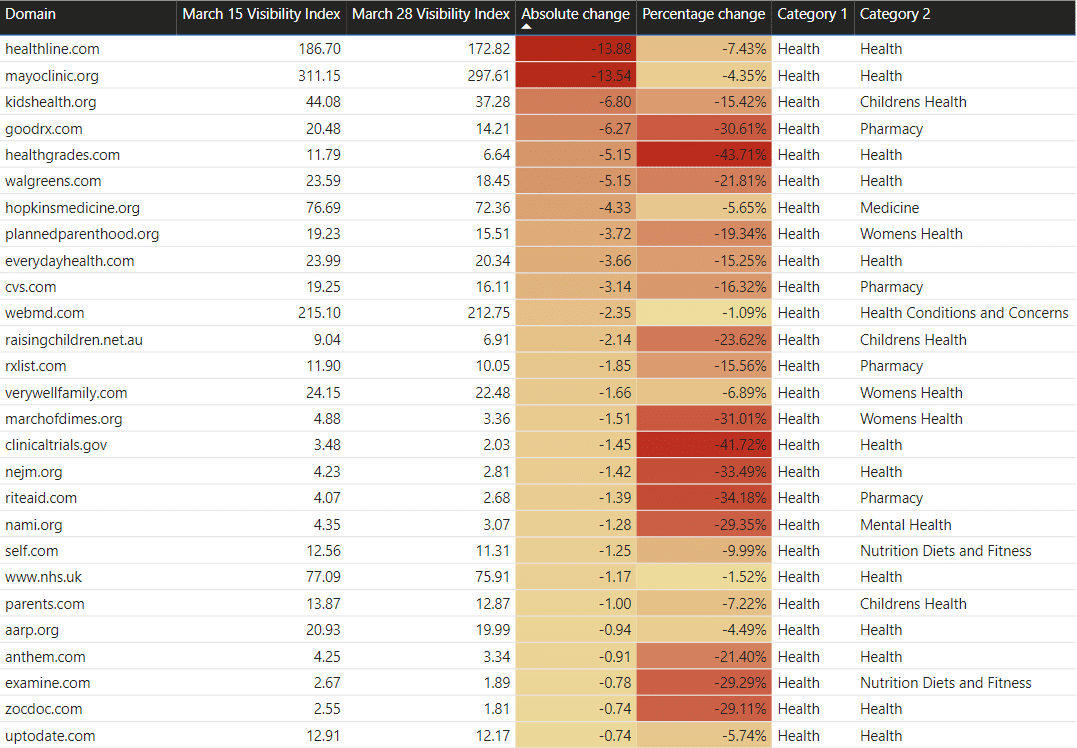
Health Sites
For several years, a number of the biggest players in the health space have gained significant market share with nearly each core update (with a couple of exceptions in recent years). This is especially true of the biggest authorities in the space, like the Mayo Clinic. This is likely due to Google’s increased emphasis on E-E-A-T for Your Money, Your Life queries, especially during crisis times like the COVID pandemic.
This update, however, caused some significant ranking declines for a number of the biggest health sites, even including the Mayo Clinic, which almost never sees visibility declines during core updates:
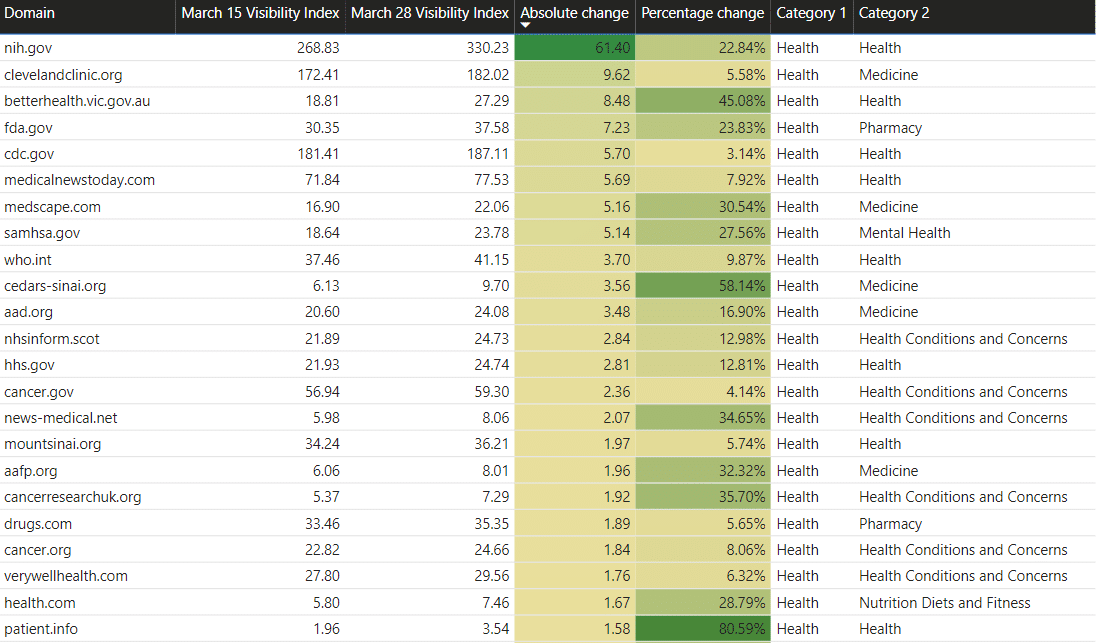
The biggest winners in this category were almost all government sites, major hospitals, or the highly trusted Cleveland Clinic, with the exception of Medical News Today and Very Well Health, which provide health information:
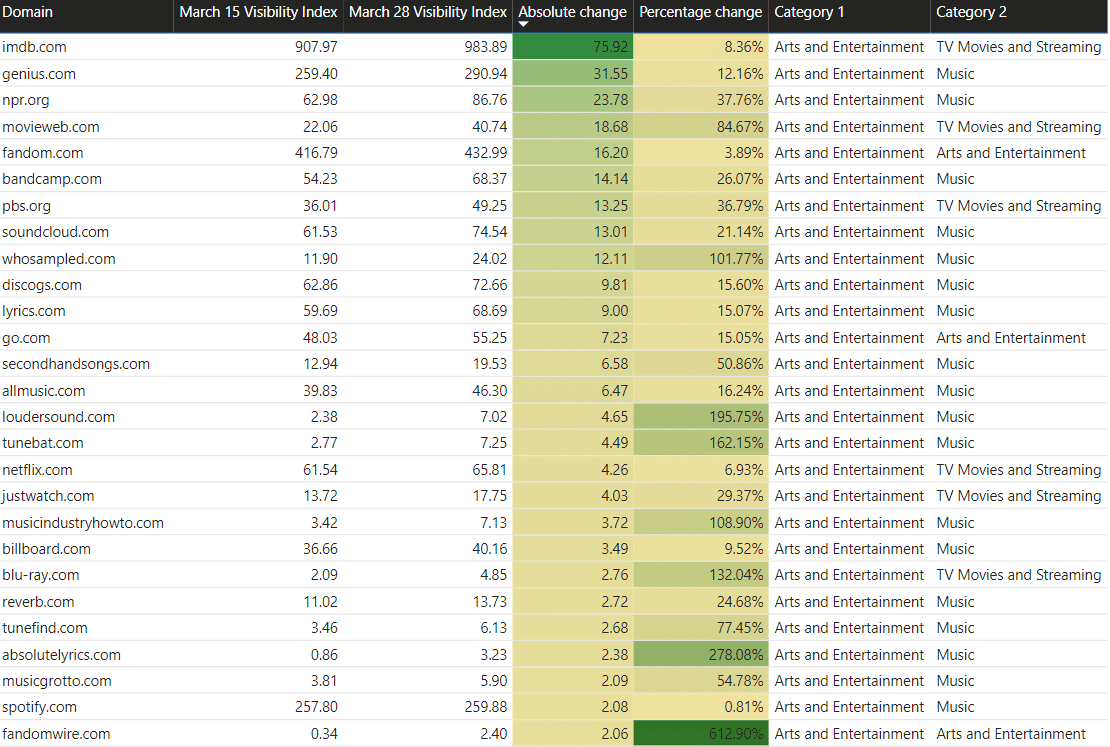
Entertainment, Music, Comics, TV & Gossip Sites
Sites in various “entertainment” categories saw big swings during this update. IMBD was the biggest winner, earning a whopping 76 visibility points, followed by Genius, which earned 31.55. Other music sites like Bandcamp, Soundcloud, Discogs, All Music, Loudersound, Tunebat, and Billboard also made it to the winner list:
There isn’t much of a clear pattern among the losers, but various lyrics sites and entertainment publishers made the list:
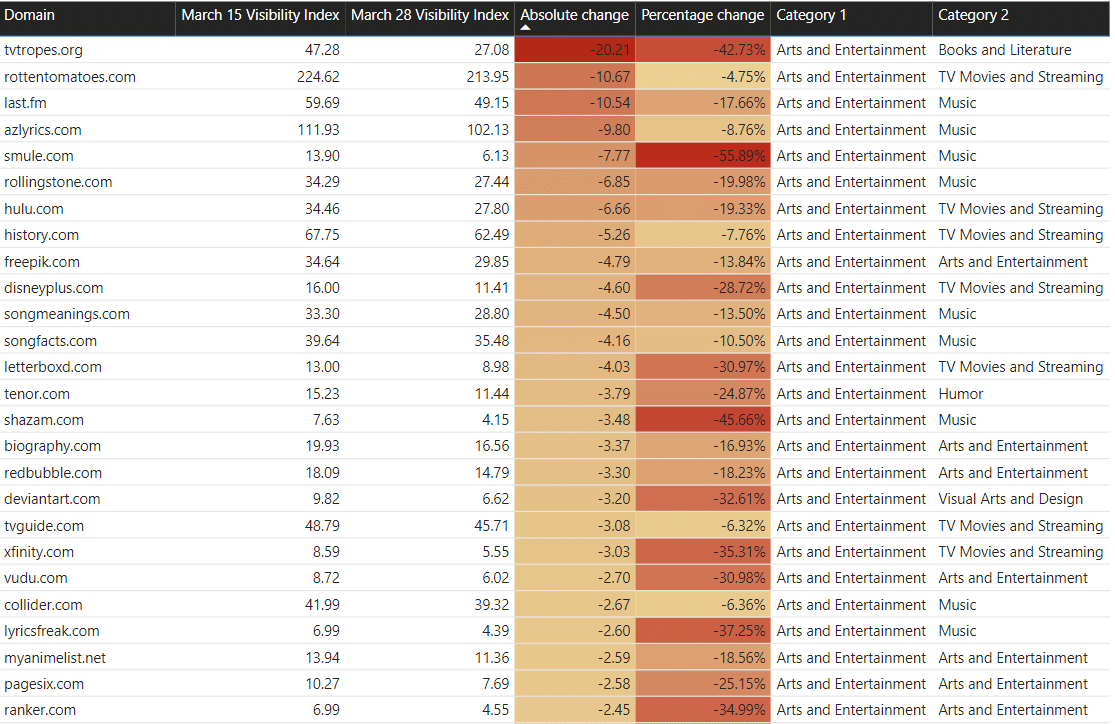
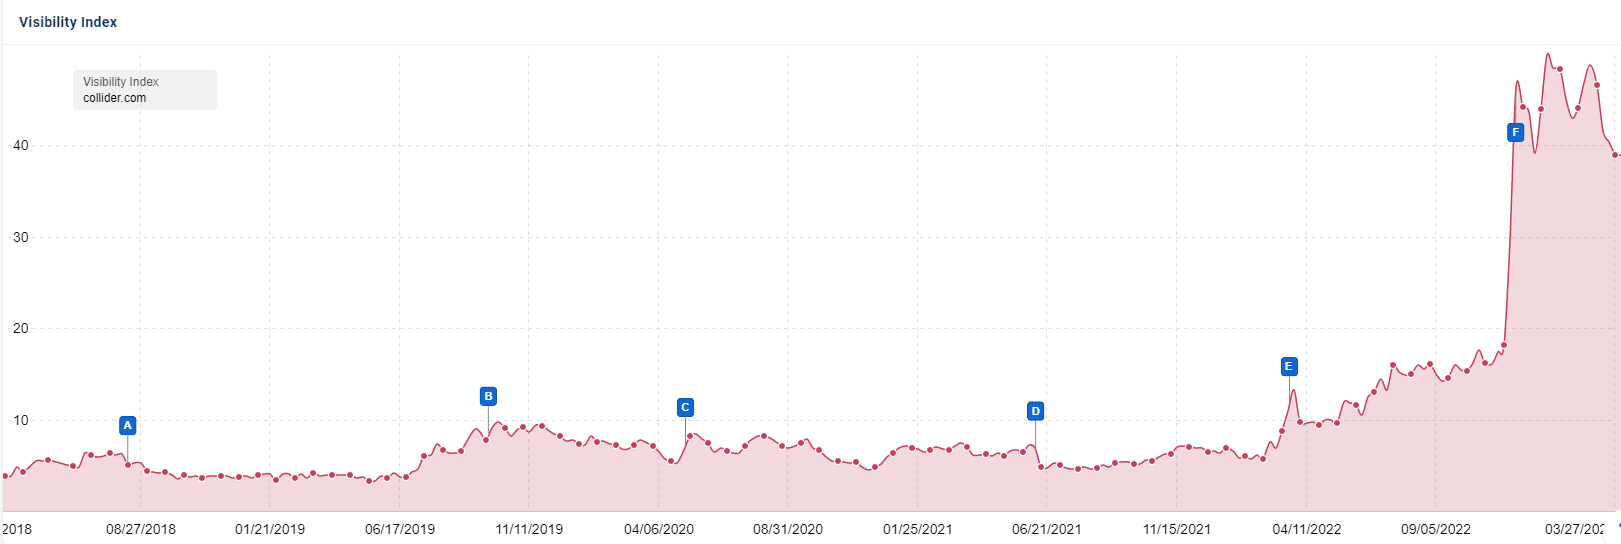
While collider.com seems like a losing site, its losses must be taken into the overall context. It was, in fact, one of the biggest winners of SEO visibility in 2022 and leading into 2023, so these losses didn’t make much of a dent in that growth:
Evidence of Experience?
Google is now weighing considerations around the “experience” of content more heavily, as noted in its Search Quality Guidelines. There are several sites where the evidence of experience is clear in the writing style, the naming of the authors and experts who write for the site, and including sufficient examples of real experience throughout the content, such as:
- pethelpful.com (577%)
- themarysue.com (633%)
- tasteofcountry.com (161%)
- realmenrealstyle.com (146%)
- therighthairstyles.com (89%)
With Google grappling with an exponential increase in AI-generated content, it’s likely that real-life human experience will continue to play a significant role in how Google measures good content quality going forward.
Conclusion
This core update showed less of a clear pattern than some prior core updates but did demonstrate a few possibilities:
- The update caused significant volatility among dictionary sites, with many sites losing significant visibility but others winning
- Many sites that aggregate information from other sources without offering their own unique product or service struggled with this update
- Some niche sites that demonstrate true “Experience” saw increases
- Some big health players slightly lost visibility, giving more room to smaller health sites
- Many music and entertainment sites benefitted from the update
We predict that this year will continue to show significant turbulence in the search results, especially as Google is forced to analyze millions of new pages either relying on or partially leveraging AI-generated content from ChatGPT and other tools. It appears this trend has already begun:
Staying up to date on the latest changes to Google is only one part of a data-centric, performance-driven strategy, giving you the power to know more and do more. Dig deeper into how Google’s latest ‘helpful content system’ update is impacting SERPs, or let’s talk about how to achieve more for your marketing — and your business.