
Consumer behaviors are changing, and so is the content they are consuming. Streaming video and video-based social content took a major leap forward in 2022, and look poised to continue their growth in the coming year. Consumer brands will need to take advantage of the right channels to reach consumers, and knowing where to start hinges on digging into the data available to get a clearer picture of where people are already spending their time and money.
What steps are you taking to gain a head start in 2023? Knowing how and where to spend your ad dollars helps you get the most out of your budget.
Partnering with Pathmatics, a leading digital media measurement company, we’ve compiled and highlighted some key trends from 2022 in the world of consumer brands. The categories we keyed in on include:
- Alternative & Vegetarian Meat & Dairy Products
- Cereals and Grains
- Non-Dairy Drinks & Nut Milks
- Sports & Energy Drinks
- Vitamins & Supplements
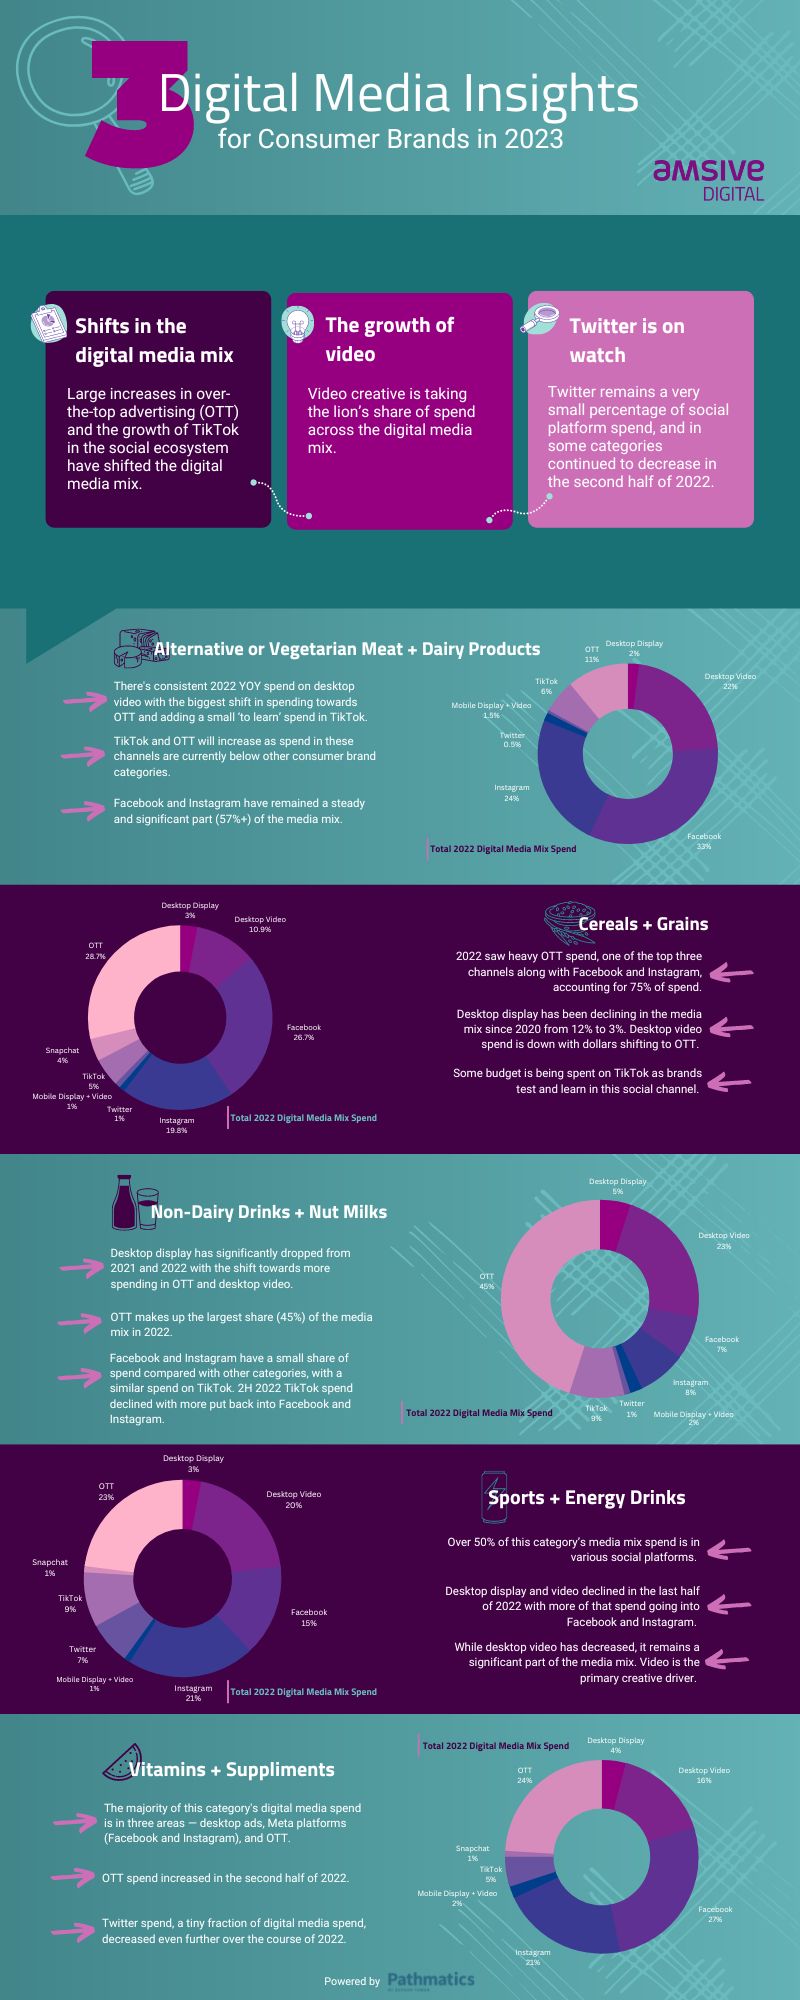
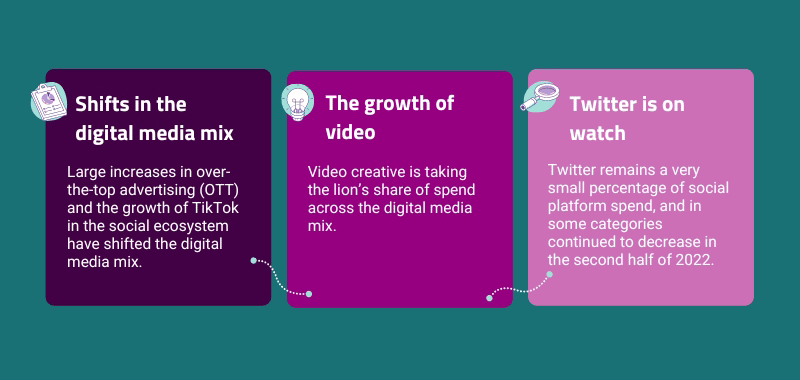
The data shows just how much the digital media mix has shifted—over the past year, we’ve seen large increases in OTT and TikTok ad spending, with video creative as a whole making up the vast majority of spend in social media.
Generally, TikTok’s share of the market grew considerably last year, with the top 1,000 advertisers in the US increasing their spend by 66% on the platform from just September to October of 2022. Along with the growing popularity of the video-sharing platform, it offers considerably lower CPM (cost per 1,000 impressions) than its social media counterparts. Consumer brands are capitalizing on this.
According to recent data, TikTok’s CPM ranges from two-thirds to more than 60% less than competitors. Over the past two years, Meta has significantly increased the CPMs of its major platforms, Facebook and Instagram, so this reduced cost and increasing reach of the newer social site offers untapped opportunities.
On the flip side, Twitter takes an extremely small percentage of spend on social platforms, and in some cases dropped even further in the second half of 2022. This infographic lays out a bird’s-eye view of these changes.
Dive Into the Key Stats to Better Understand the Digital Media Landscape
As mentioned above, the key insights we gleaned from the collected 2022 data were threefold:
- Shifts to where ad dollars are going. OTT made up the highest percentage of spend in three out of five of the highlighted categories, with only alternative and vegetarian meat and dairy products significantly outspending in other areas. While TikTok ad spend was notably lower, its meteoric rise in market share cannot be dismissed. Short-form video as a whole is gaining prominence across social media and video sites and will continue to increase its hold on public attention.
- Increases in video spend. Every single category saw significantly higher spend on video ads compared to display ads in 2022, ranging from 3.6x higher spend in Grains and Cereals to as much as 11x higher in Alternative & Vegetarian Meat & Dairy Products.
- Twitter’s ad share is falling. Twitter’s advertising woes have been well-documented over the past several months, so it should come as no surprise that the social media site saw limited numbers in our data. Beyond these recent troubles, consumer brands don’t normally advertise on Twitter—they want to appear where their customers are, which is overwhelmingly on other sites like Facebook, Instagram, and the newest rising juggernaut TikTok. Whether this site recovers those lost advertisers is a hot topic in the tech world and bears paying attention to it as the company likely makes new pushes to regain its financial footing.
With these overarching insights in mind, let’s dig deeper into the five pivotal consumer brand categories we have outlined.

Alternative & Vegetarian Meat & Dairy Products
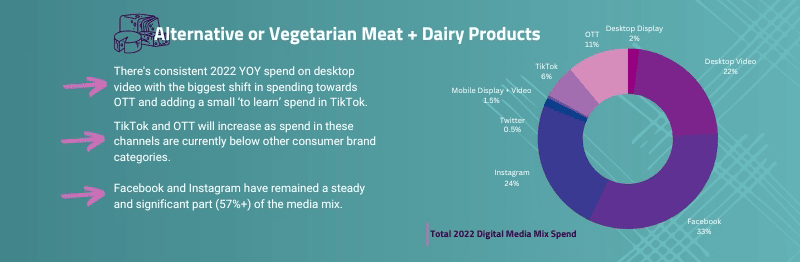
Desktop video spending saw a notable increase in the back half of 2022, jumping from 15.7% of the total spend to 22%. On the flip side, Facebook and Instagram ad spending both dropped—35.3% to 33% and 31.4% to 24% respectively—in the back half of the year. Even with those drops, Meta’s platforms had a dominant hold on this space in 2022.
Cereals and Grains
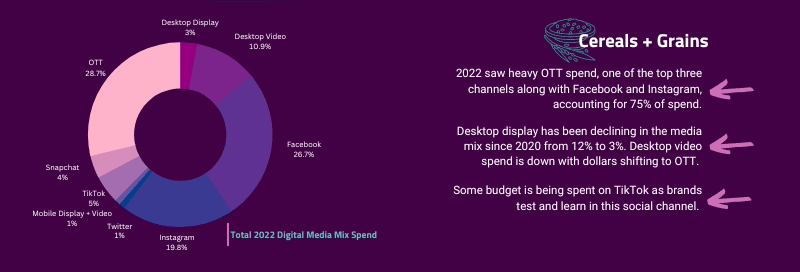
Facebook, Instagram, and OTT ad spending account for 76% of all ad dollars in the Cereal and Grains space. Some of this dominance is a result of ad dollars moving away from desktop display—down to just 3% of the total, compared to 12% as recently as 2020—and the growth of TikTok as a platform. Brands are still in the experimental phase with TikTok, and that number will likely continue to grow moving forward.
Non-Dairy Drinks & Nut Milks
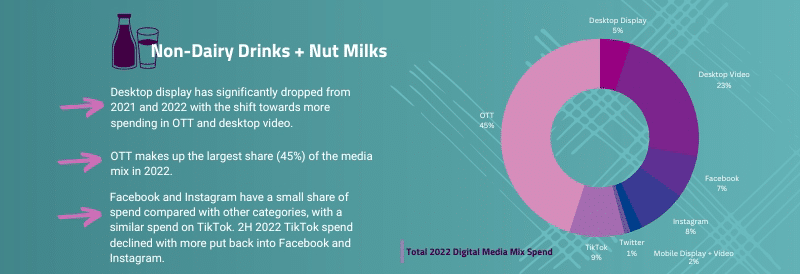
OTT is king when it comes to this category, taking up 45% of the total ad spend for 2022. It dipped a little from the first half of the year when it made up nearly 50% of total spending, but no other area even came close. Mobile and desktop display ads continue to decline year over year, and Meta saw increases in both Facebook (3.8% to 7%) and Instagram (6.7% to 8%) over the back half of the year. This is the only category covered here where these platforms didn’t see a double-digit share of ad spend last year.
Sports & Energy Drinks
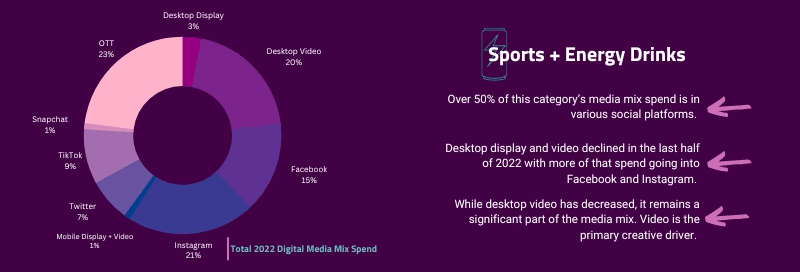
Social platforms were the major target of advertisers in this space, with a notable percentage of spending diverting from desktop display and video ads to Facebook and Instagram in particular. While desktop video ads are taking up less space than they have in the past, it remains a significant part of the landscape. Video content as a whole is the primary creative driver of this advertising space and figures to remain so going into 2023 and beyond.
Vitamins & Supplements
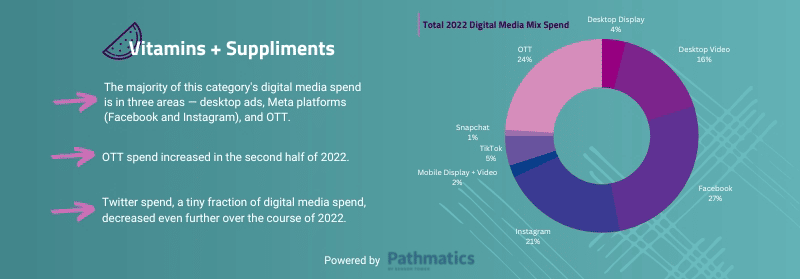
Desktop display ad spending significantly dropped through 2022, making up 13.4% of spending in the first half of the year compared to just 4% by the end. OTT, Instagram, and TikTok were the main beneficiaries, increasing by 4.5%, 3%, and 1.9% respectively. OTT nearly caught up to Facebook’s total spend by the end of the year with that significant bump—27% vs. 24%—and if the trend continues, could potentially overtake the Meta platform by the end of this year. However, Meta’s overall dominance, 48% of all spending across its two major platforms, is likely to continue.
Understanding the digital media landscape is a vital step for consumer brands and marketers, both those with a more limited budget in 2023 and those looking to get an edge over their competitors. With the rise of TikTok and the shift in ad dollars to streaming services, access to and understanding of data and insights will play a huge role in the continued success of marketing campaigns.
Understanding how best to spend your ad dollars is only one part of a data-centric, performance-driven strategy, giving you the power to know more and do more. Dig deeper into how consumer brands can thrive in today’s social ecosystem, or let’s talk about how to achieve more for your marketing—and your business.